- When: Monday, October 23, 2023: 9:00 AM-12:00 PM AEDT (UTC+11)
- Where: VIS 2023, Melbourne Convention and Exhibition Centre, Melbourne, Australia
- Contact Us:
vis4good-org@googlegroups.com, @vis4good
Welcome
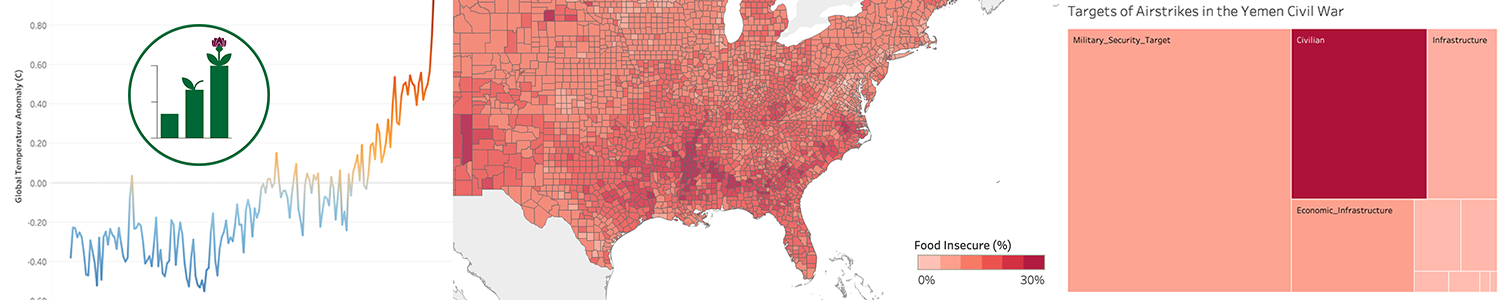
We are proud to announce the third Workshop on Visualization for Social Good to be held as part of IEEE VIS 2023. The goal of this workshop is to:
- provide a central venue within the IEEE VIS community for surfacing work that critiques, defines, or explores the impact of data visualization on society in order to build just and equitable futures.
Data is an inescapable part of our lives: it guides commerce, government, and technology, and increasingly determines what lives we can (or cannot) live. Data visualization has a special place within this emerging, data-driven, order: as a tool to inform or persuade mass audiences, guide or enlighten the specialist, or give a voice to the unheard. We therefore pose the question: how can visualization, and visualization research, help us build the worlds we want? This theme, building just and equitable futures, is the motivation behind the third edition of our recurring workshop at IEEE VIS: Visualization for Social Good. Our workshop series has been successful not only at showcasing high-quality socially-minded visualization research from diverse voices, but also in starting important conversations around the role of data visualization as a force for good in society at large. We invite you to join our workshop and growing community on Visualization for Social Good, to navigate conversations about the role of data in human dignity and flourishing.
Schedule
Call for Papers
We as designers, researchers, and technologists, have many opportunities ahead of us, as laid out in aspirational plans like the UN Sustainable Development Goals, the NAE Grand Challenges for Engineering, and the NSF 10 Big Ideas. Yet, as the “techlash” continues, we are also seeing how technology has the power to magnify inequality, injustice, or other societal ills.
With the power that comes with collecting, interpreting, and communicating data in visualization, there is naturally a social responsibility. To do good and avoid harm, we should make our values as a field explicit, criticize and critique the work we do that has a potential for harm, develop a pedagogy around the socially responsible design and use of visualization, and develop good patterns for fruitful collaboration with stakeholders working on key societal problems.
To that end, we are soliciting work that deals with the social impact of visualization work. In order to focus the goals of our workshop, provide inspiration to potential attendees or submitters, and to reflect on the pressing issues of contemporary importance, we propose the following theme for the 2023 workshop: building just and equitable futures.
Some potential questions of interest include:
- How can we adapt our ways of teaching, designing, or intervening in the face of imminent widespread societal, technological, or environmental change?
- What audiences are included or excluded in our visualizations? How can data visualization be used to empower marginalized communities?
- What role can data visualization play in promoting transparency and accountability in public and private sector decision making, especially as decision-making becomes increasingly automated and data-driven?
Contributions
Potential contributions might include (but are not limited to):
- Design studies, “collaboration journals,” or other best practices for visualization work in domains with high social impact. Examples include:
- Public health, development, and sustainable growth
- Inclusivity, accessibility, and disability rights
- Diversity, racial equality, and gender equality
- Sustainability, ecology, and environmental activism
- Explorations of design considerations for visualizations for mass audiences or policymakers. Examples include:
- Building statistical or visualization literacy and fluency
- Persuasion, misinformation, and deception
- Accessibility
- Critiques, manifestos, or provocations around social or ethical responsibilities in visualization design or research
Consult our resources page, 2021 workshop, 2022 workshop for sample works.
Submissions
Papers will be up to four pages, plus up to one page of references, in VGTC two-column format. Authors may elect to have their paper included archivally, or, per the authors’ request (e.g., for in-progress work), to have the work be presented but excluded from formal conference proceedings. The deadline for paper submissions is July 03, 2023.
Important Dates
- Submission Deadline:
July 3, 2023July 10, 2023 (no separate abstract deadline) - Notification: August 1, 2023
- Submission of Camera-Ready Final Version: August 15, 2023
All deadlines are at 11:59pm (23:59) AoE Anywhere on Earth (AoE).
Keynote

Computer Scientist, Professor, Artist
Keynote Title: Tilting at Windmills
The focus of this talk will be on the struggles of starting our latest project. Recently, in our efforts to take a positive human-centred approach, we decided to take on just a few of the UN’s research priorities: 1) how can digital technologies be harnessed to promote social cohesion while ensuring no one is excluded?, 2) how can policy solutions promote the well-being of informal workers and ensure their long-term economic equity?, 3) how can recovery efforts from emergencies help eliminate pre-existing social inequities in order to enhance the resilience of communities? In our words, our intentions are – to create effective tools to track and demonstrate the societal and economic benefits of the local community based arts, to enable evidence-based policy that supports and grows the community arts. In particular Indigenous, youth and LGBTQ communities, are remarkably under-resourced and under-supported, with an unsustainably high level of reliance on volunteers. Lack of economic policies based on real, community-based data undermines the ability to effectively support sustainable community livelihoods and well-being. We will enable pluralistic, community-inclusive, evidence-based economic policies to better support sustainable economic development and diversification. We will leverage data visualization as a co-creative data empowerment process with and for communities to better support community members in collecting, understanding and communicating data for the purpose of evidence-based economic policy development.
The questions now are – can we really do this? How much do we have to un-learn to discover new ways?
BIO: Sheelagh Carpendale is a Professor and Canada Research Chair at Simon Fraser University. Her many awards include: IEEE Visualization Career Award, NSERC STEACIE (a Canadian Top Science Award); a BAFTA (British Academy of Film & Television Arts – similar to an Oscar in USA), two Best Supervision awards. She is also a Fellow Royal Society of Canada and is in the IEEE Visualization Academy and the ACM CHI Academy. Her research focuses on information visualization, interaction design, and qualitative empirical research. By studying how people interact with information in work and social settings, she works towards designing more natural, accessible and understandable interactive visual representations of data. She combines information visualization and human-computer interaction with innovative new interaction techniques to better support the everyday practices of people who are viewing, representing, and interacting with information.
Program Committee
- Catherine D’Ignazio, MIT
- Sean McGregor, Syntiant, Partnership on AI, XPrize Foundation
- Ab Mosca, Northeastern University
- Doug Markant, UNC Charlotte
- Ryan Wesslen, UNC Charlotte
- Priya Dhawka, University of Calgary
- Natkamon Tovanich, École Polytechnique
- Georgia Panagiotidou, University College London
- Mahmood Jasim, UMass Amherst
- Alyx Burns, Mount Holyoke College
- Zack While, UMass Amherst
Organizers


Steering Committee
- Evan Peck, University of Colorado - Boulder
- Michael Correll, Tableau Software
- Michelle Borkin, Northeastern University
- Lane Harrison, Worcester Polytechnic Institute
- Leilani Battle, University of Washington