Workshop 2021
- When: October 25, 2021. 8:00am - 11:25am Central Time (USA)
- Where: Virtual VIS 2021
- Contact Us:
vis4good-org@googlegroups.com, @vis4good
Welcome
We are proud to announce the first Workshop on Visualization for Social Good to be held as part of IEEE VIS 2021. The goal of this workshop is to:
- provide a central venue within the IEEE VIS community for surfacing work that critiques, defines, or explores the impact of data visualization on society.
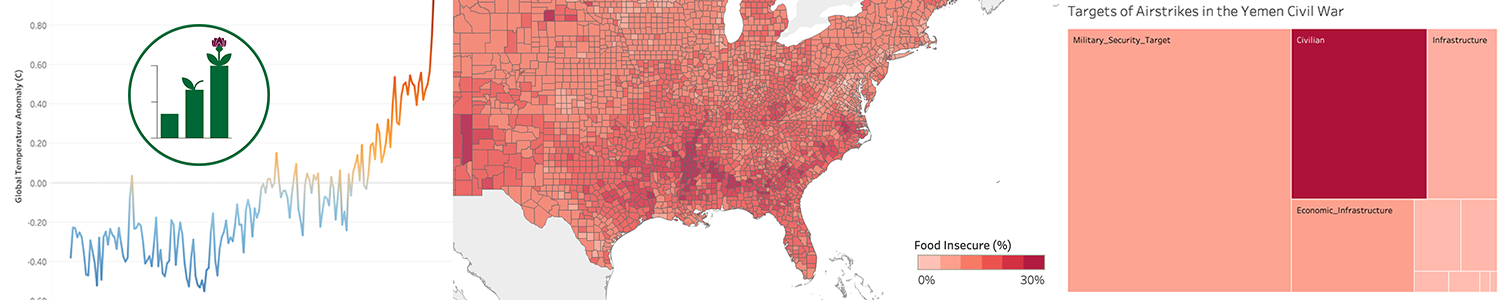
Visualization, like all fields connected with how we collect, interpret, and communicate data, has an immense potential impact on society, for good or for ill. It is up to us to make sure our work affects positive change in the world. The Visualization for Social Good Workshop (Vis4Good) aims to provide a central venue within the IEEE VIS community for surfacing work that critiques, defines, or explores the impact of data visualization on society. Through a blend of paper sessions, invited presentations, and break-out groups, we hope that the inaugural Vis4Good 2021 Workshop encourages attendees to harness visualization research to tackle critical challenges in responsible AI, clean energy, human health and well-being, and other domain areas with critical societal impact.
Schedule
| Time(CDT) | |||
|---|---|---|---|
| 8:00-8:15 | Introduction & Welcome | ||
| 8:15-9:00 | Keynote: Applying Racial Equity Awareness in Data Visualization | Jon Schwabish, Alice Feng | |
| 9:00-9:25 | Paper Session 1 | ||
| CleanAirNowKC: Building Community Power by Improving Data Accessibility | Rifat Ara Proma, Matthew Sumpter, Humberto Lugo, Elizabeth Friedman, Khandaker Tasnim Huq, Paul Rosen | ||
| Local, Interactive, and Actionable: a Pandemic Behavioral Nudge | Alex Rich, Cameron Yick, David Gotz | ||
| 9:25-10:00 | Break | ||
| 10:00-10:36 | Paper Session 2 | ||
| Making the Invisible Visible: Risks and Benefits of Disclosing Metadata in Visualization | Alyxander Burns, Thai On, Christina Lee, Rachel Shapiro, Cindy Xiong, Narges Mahyar | ||
| Feral data visualization: A manifesto for cultivating livable worlds with visual sensemaking practices | Cathryn A Ploehn, Molly Wright Steenson, Daragh Byrne | ||
| The importance of engaged communities for social good visualisation | Neil Richards | ||
| 10:36-10:56 | Lightning Talks | ||
| Facilitating Visualization for Social Good in Academic Courses | Uzma Haque Syeda, Michelle Borkin | ||
| Visualizing Urban Accessibility: Understanding Sensemaking Processes across Multiple Stakeholders | Manaswi Saha, Jon Froehlich, Jeffrey Heer | ||
| Representing Systems of Need and Satisfaction | Michael Hoefer, Stephen Voida | ||
| Visualizing Sexual Harassment Testimonies: Academia is Tied in Knots | Tommaso Elli, Adam Bradley, Christopher Collins, Uta Hinrichs | ||
| 10:56-11:05 | Closing Remarks | ||
| 11:05-11:25 | Break Out Session |
Call for Lightning Talks
To include diverse perspectives beyond our accepted research papers on this topic, we are introducing lightning talks: a low-barrier way to present research/design studies (even if they have been presented at other venues!), provocations/critiques, or organizations that contribute to the mission of our workshop.
We expect that each lightning talk will consist of roughly 3 minutes of speaking time during the workshop (time may vary depending on submissions) and a single slide. All talks and presenters will be advertised on the website as well as in our social media promotional material.
Submissions should be made at: https://bit.ly/vis4good-lightning
Call for Papers
We as designers, researchers, and technologists, have many opportunities ahead of us, as laid out in aspirational plans like the UN Sustainable Development Goals, the NAE Grand Challenges for Engineering, and the NSF 10 Big Ideas. Yet, as the “techlash” continues, we are also seeing how technology has the power to magnify inequality, injustice, or other societal ills.
With the power that comes with collecting, interpreting, and communicating data in visualization, there is naturally a social responsibility. To do good and avoid harm, we should make our values as a field explicit, criticize and critique the work we do that has a potential for harm, develop a pedagogy around the socially responsible design and use of visualization, and develop good patterns for fruitful collaboration with stakeholders working on key societal problems.
To that end, we are soliciting work that deals with the social impact of visualization work. Potential contributions might include (but are not limited to):
- Design studies, “collaboration journals,” or other best practices for visualization work in domains with high social impact. Examples include:
- Public health, development, and sustainable growth
- Inclusivity, accessibility, and disability rights
- Diversity, racial equality, and gender equality
- Sustainability, ecology, and environmental activism
- Explorations of design considerations for visualizations for mass audiences or policymakers. Examples include:
- Building statistical or visualization literacy and fluency
- Persuasion, misinformation, and deception
- Accessibility
- Critiques, manifestos, or provocations around social or ethical responsibilities in visualization design or research
Consult our resources page for sample works.
Papers will be up to four pages, plus up to one page of references, in VGTC two-column format. Authors may elect to have their paper included archivally, or, per the authors’ request (e.g., for in-progress work), to have the work be presented but excluded from formal conference proceedings.
Submissions will be made via PCS and single-blind reviewed by the program committee.
Important Dates
July 23: Paper Submission DeadlineAugust 9: Reviews DueAugust 18: NotificationsAugust 27: Camera-Ready DeadlineSeptember 24: Lightning Talk Submission DeadlineOctober 1: Lightning Talk Notification- October 25: Workshop Date
Keynote Speakers
Urban Institute
Urban Institute
Applying Racial Equity Awareness in Data Visualization How can analysts, researchers, and developers apply a race- and ethnicity-conscious lens to their data analysis and data visualization work? How can we take a more diverse, equitable, and inclusive (DEI) perspective to our research, data, and visualizations? Just as we carefully consider our written words, we should be equally careful in how we visually present data to our readers, users, and audiences, including the words we use in and around those visuals. Taking a DEI perspective means considering how the specific lived experiences and perspectives of the people and communities we are studying, as well as our readers, will perceive information and carry that information forward. In this talk, we discuss a variety of techniques that data visualization producers should consider when creating visuals with this DEI approach.
Dr. Jonathan Schwabish is an economist, writer, teacher, and creator of policy-relevant data visualizations. He is considered a leading voice for clarity and accessibility in how researchers communicate their findings. His book Better Presentations: A Guide for Scholars, Researchers, and Wonks helps people improve the way they prepare, design, and deliver data-rich content and his edited book, Elevated the Debate: A Multilayered Approach to Communicating Your Research, helps people develop a strategic plan to communicating their work across multiple platforms and channels. His latest book, Better Data Visualizations: A Guide for Scholars, Researchers, and Wonks details essential strategies to create more effective data visualizations. He is on Twitter @jschwabish.
Alice Feng is a data visualization developer based in the Washington, DC area. She is passionate about using design to make data and information more accessible to broader audiences and recently has been exploring ways to bring more diversity, equity, and inclusion into the way we visualize data. Her work has appeared in The Parametric Press and The Pudding. Previously, Alice worked as a data viz developer at the Urban Institute where she built interactive and static data visualization features and tools communicating public policy research. Alice is currently embarking on a new adventure at Natera. She is on Twitter @fleecealeece.
Program Committee
- Lyn Bartram, SFU
- Vetria Byrd, Purdue
- Catherine D’Ignazio, MIT
- Mennatallah El-Assady, University of Konstanz / Ontario University
- Jessica Hullman, Northwestern
- Lauren Klein, Emory
- Crystal Lee, MIT
- Sean McGregor, Syntiant, Partnership on AI, XPrize Foundation
- Ronald Metoyer, Notre Dame
- Ab Mosca, Tufts
- Philippe Rivière, Visioncarto.net
- Arvind Satyanarayan, MIT
- Jon Schwabish, Urban Institute
- Uzma Haque Syeda, Northeastern
- Emily Wall, Northwestern
Organizers


Code of Conduct
IEEE VIS is committed to providing an inclusive and harassment-free environment in all interactions regardless of gender, sexual orientation, disability, physical appearance, race, or religion. This commitment extends to all IEEE VIS sponsored events and services (webinars, committee meetings, networking functions, online forums, chat rooms, and social media) and any interaction regardless of affiliation or position. As a community that aims to share ideas and freedom of thought and expression, it is essential that the interaction between attendees take place in an environment that recognizes the inherent worth of every person by being respectful of all. IEEE VIS does not tolerate harassment in any form. Harassment is any form of behavior intended to exclude, intimidate, or cause discomfort. Harassment includes, but is not limited to, the use of abusive or degrading language, intimidation, stalking, harassing photography or recording, inappropriate physical contact, and unwelcome sexual attention.
Anyone who experiences, observes, or has knowledge of threatening behavior is encouraged to immediately report the incident to ombuds@ieeevis.org. All information shared will be kept confidential. In cases where a public response is deemed necessary, the identities of victims and reporters will remain confidential unless those individuals consent otherwise.
IEEE VIS reserves the right to take appropriate action to foster an inclusive and respectful environment. Attendees violating these rules may be asked to leave the conference without a refund, at the sole discretion of the conference organizers. In addition, attendees are subject to the IEEE Code of Ethics.
Contact
Please contact ombuds@ieeevis.org if you experience, observe, or have knowledge of behavior in violation of the Code of Conduct.
Please contact inclusivity@ieeevis.org with any questions about the Code of Conduct and Inclusivity & Diversity at IEEE VIS.